They are all excellent but not always customized exactly for our facilities needs. I was always adding a line, a note, a parameter, a category or a factor. I started to develop my own charts that more closely reflected our needs. With today’s easy access to document manipulation this is easy and makes life simpler in the morning when most of the QC is accomplished with patients pacing in the waiting room, tapping their collective toes and breathing down your neck.
Here are a few of my custom charts. Copy them if you want, peruse them for ideas for developing your own documents or just look, change, imitate and employ.
THE CHARTS:
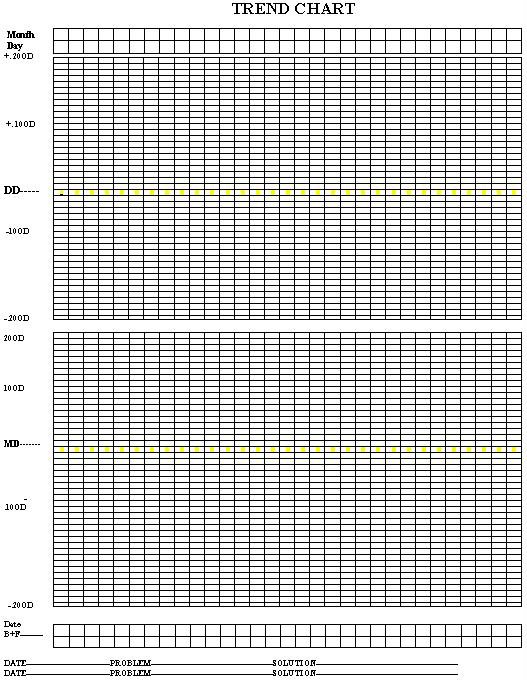
- Trend charts
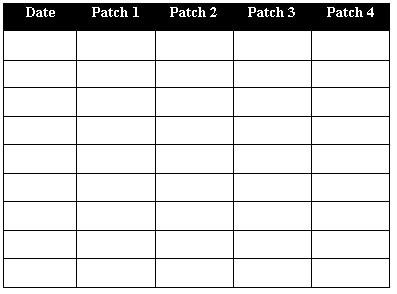
- Fixer retention log
- Daily optical density
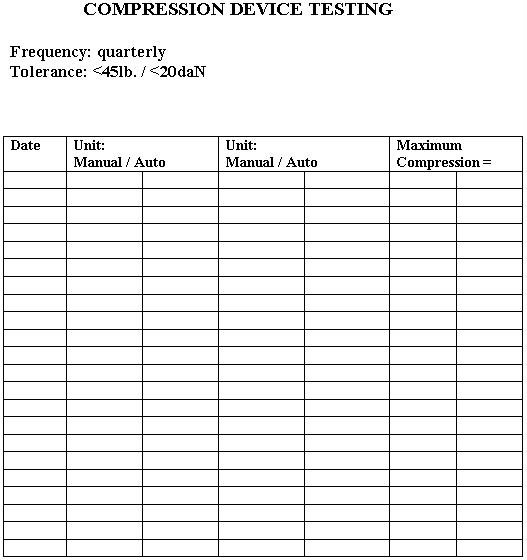
- Compression test
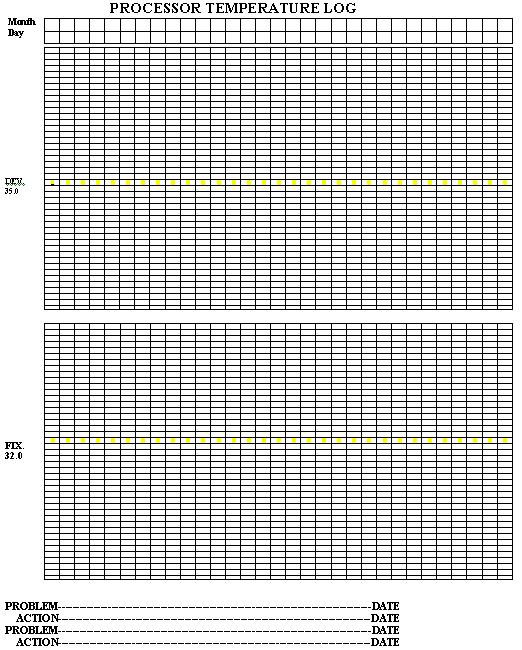
- Processor temperature log
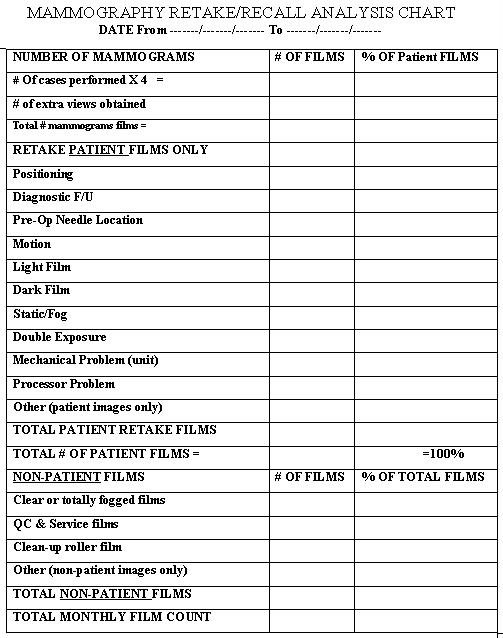
- Recall/retake analysis
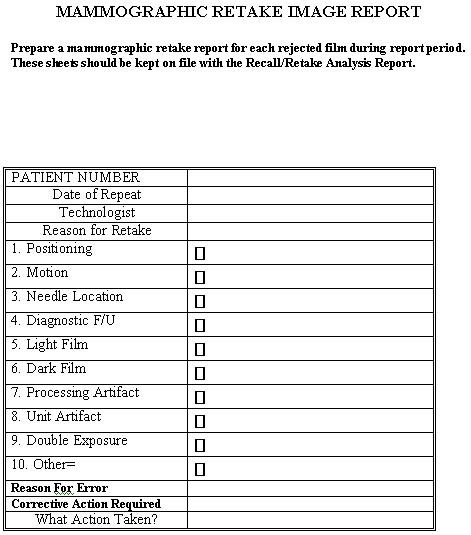
- Retake image sheet
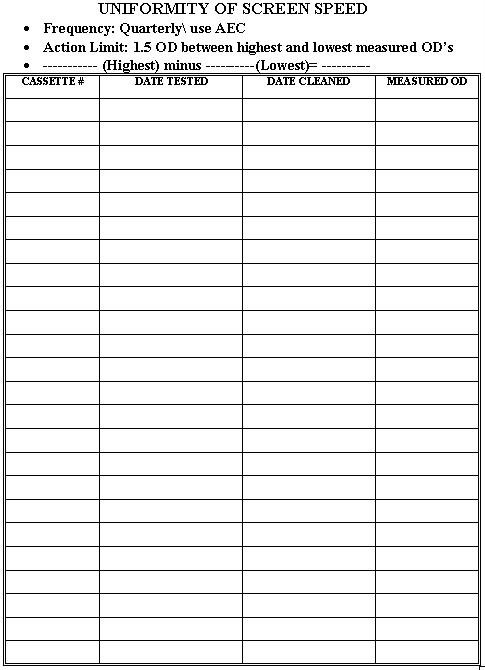
- Screen speed uniformity
- Film/screen contact
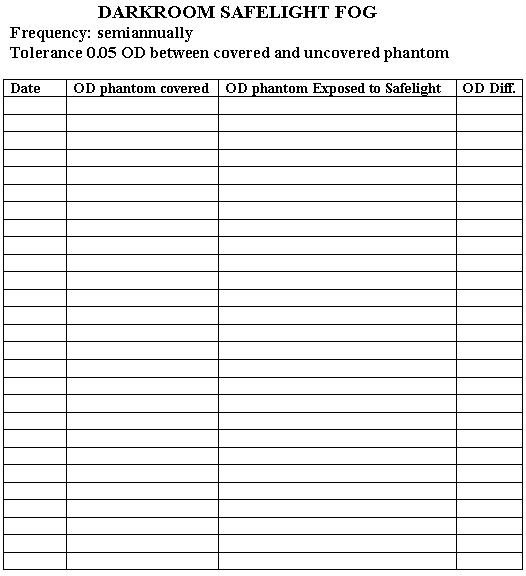
- Darkroom safelight fog test
- Darkroom white-light fog test
- Year-at-a-Glance
FIXER RETENTION HYPO-TEST


SUMMARY:
We are the thin line between perfection and adequacy. It is up to us how to best implement the many tests, checks and balances that make up a good Quality Control Program. Our facilities are unique and our charts and logs should reflect that. Use these as a guide and be creative. Good luck and don’t be shy about changes that improve the effectiveness of your work.

